Monday 6 May 2013

The Local Elections in Graphs

After recovering from the all night election analysis at the BBC, I've put together some graphs that show some of the key results in the key wards we cover.

Some topline results

The following graphs show some of the interesting results we saw across the key wards. The first thing to realize about these elections is that they were in very Conservative leaning areas. Even after the UKIP surge, the mean ward result in our dataset looked like this:


Nonetheless, the UKIP share is an incredible performance for a small party. But the picture is very different when we look at the ward distribution. The ward results look surprisingly similar to the status quo with the tories capturing more than half the wards. 

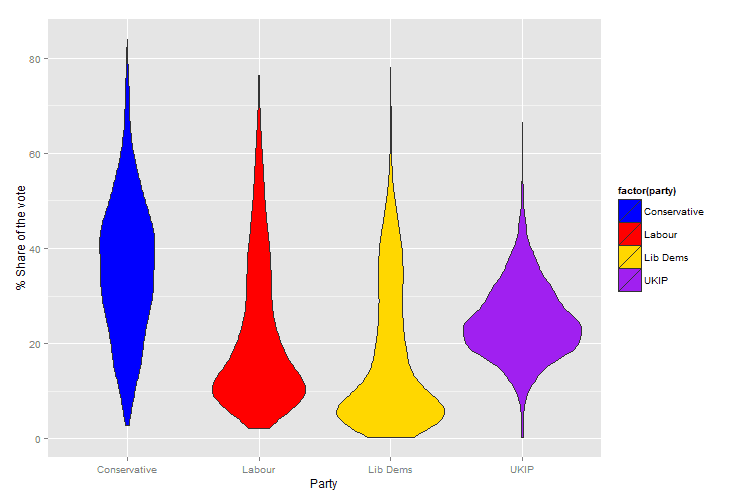
In particular, UKIP goes from second in vote share to fourth in seats. As Steve Fisher, another BBC psephologist and lecturer at Trinity College Oxford, argues, this discrepancy is largely the result of UKIP's vote distribution. The violin plot below shows the vote distribution for each party i.e. how many wards each party got a given percentage of the vote in. If we look at the Liberal Democrats and Labour, they show a highly skewed distribution: they get very low shares in a high proportion of wards with a long tail of better performances where they manage to get seats. By contrast, the UKIP vote is close to normally distributed with little skew. 


The point is inadvertently put best by the UKIP Mayor of Ramsey who tweeted:
The distribution of UKIP's vote ensures that they receive a very high number of second place results.

It's not only the vote distributions that cause problems for UKIP. It's also the distribution of their vote changes. The following graph shows the distribution of the vote changes for each party since the 2009 elections. Given that the three major parties each started from a more efficient baseline (in terms of votes to seats) than UKIP, UKIP would ideally want to have a more skewed set of changes. However, we see exactly the opposite. Labour made 209 gains from a 7.9 percentage point increase compared with UKIP gaining 118 seats from an 11 percentage point gain. This is at least partially because of it's skewed vote increases. Labour has a long tail of increases which, along with its initially skewed performance, led to its strong ward performance.

Thanks to Steve Fisher, John Curtice and Rob Ford for their work on the results and the whole BBC elections team. Note: this post does not reflect the views of the BBC.


How the BBC elections work

Some background. The BBC monitors the results in a set of councils intended to be representative of the election as a whole. In this election they monitored 21 of the 35 councils. With people posted in each area to phone in the results as they happened. This allowed us (the psephologists) to get an up to the minute picture of the election as it happened (mostly at 2am when there was no election programme on air). We collect a variety of demographic and political information about all of the key wards covered and we use this to help inform the viewers about what the results mean, particularly through John Curtice's analysis.


Friday 3 May 2013

Will general election turnout stop UKIP repeating their performance?

UKIP's record breaking performance has the world (or that subset of it that follows English local elections closely) talking about whether they might repeat this performance at the general election. If they did, then they might replace the Liberal Democrats as the third party in the House of Commons.

Before getting carried away with speculation on Nigel Farage's role in a future coalition government, it is worth considering some factors that might limit this. One factor is the odd electorate that votes in local elections. While the BBC's projected national share accounts for the difference in the areas that vote, it doesn't account for the difference in the electorate that turns out. These differences can be large, just 31% of eligible voters made it to polling stations yesterday compared to the 65% who voted on election day.

These differences aren't random either. In particular, local elections voters are much older  those at general elections (broadly, the elderly will turnout in every election whereas the young tend to only show up for high profile contests). Conservatives and liberal democrats have been the traditional beneficiaries of this differential turnout but UKIP has a strong base of support among the elderly.

So what would these results have looked like if the turnout had been 65% rather than 31%. To give a rough answer to this question I looked at how much share UKIP gained since 2005 (a general election) in each ward depending on how turnout changed between the 2005 General Election and 2013's local contests.


UKIP vote change 05-13
Turnout change 05-13
-0.065

(2.42)*
_cons
17.810

(15.14)**
R2
0.03
N
163
* p<0.05; ** p<0.01


As expected, UKIP improved their performance more in contests that saw a sharper drop in midterm turnout. However, this would not have been sufficient to dent their performance greatly: they would lose a total of 2 percentage points bringing them from a 23 point PNS to a 21 point result.

While UKIP benefited from low turnout, it is not enough to begin to explain their huge electoral gains. It will take more than robust turnout to reverse their success in these elections.


Note: These results are also robust to a set of controls:


UKIP vote change 05-13
Turnout 05-13
-0.061

(2.25)*
Population Density
-0.015

(0.29)
% aged 65+
0.293

(2.05)*
% white
-0.156

(0.67)
% aged 18-24
-0.193

(1.27)
_cons
28.916

(1.31)
R2
0.10
N
160
p<0.05; ** p<0.01


Caveats:

  • See previous post
  • I realise I'm in danger of contributing to the "questions to which the answer is no" genre of blog writing. In my defense I didn't know that the answer would definitely be no in advance. 


Blown away: How much impact did wind farms have on the UKIP vote?

UKIP's rapid rise has led to certain gaps in their policy platform. The party's core issues of immigration and Europe have been fully articulated but the rest of the platform is still in a state of flux. Another line of policy has been to take up various "NIMBY" (not in my back yard) issues. For instance, their Yorkshire and Lincolnshire webpage gives high prominence to the wind farms. In fact it's the only policy area mentioned on the site other than Europe.

So what should we make of this NIMBY focus? Is it a key part of their appeal or just window dressing around their core anti-immigration/EU message? 

Taking a first look at this, I've compared the UKIP performance in wards where there is a wind farm to those without one. I was helped in this by a wikipedia article listing the coordinates of all onshore wind farms in the UK (I am very intrigued about who put this together) and the ever useful mapit API. 

For now I'm simply analysing the difference across the BBC's keywards (those councils that they analyse in detail) that have declared results  (as of 3.31pm 3/5/2013), so these results are very preliminary. Among these wards, 19 have wind farms and 14 of these have UKIP candidates standing.

In these 14 wards UKIP averaged 32.7% of the vote, this compares with a share elsewhere of 24.6% (n = 1170). If this is robust (a big if), it would make the presence of wind farms one of the biggest effect on UKIP share.

Of course, it may simply be that UKIP does well in rural areas, which also tend to be the ones containing wind farms. 

A quick regression analysis suggests that this isn't the case. Although the difference is not quite as large as the raw figures, they still perform 6 percentage points better in wards with wind farms that those without. 


UKIP 2013 share
Population density
-0.054

(3.49)**
Wind Farm
6.160

(2.86)**
_cons
25.689

(73.17)**
R2
0.02
N
1,083
* p<0.05; ** p<0.01

So the analysis so far suggests that NIMBY issues may have some potential for UKIP. 

But wind farms are only relevant to a small number of wards. A second NIMBY issue that might have more wider relevance is High Speed 2. The proposed route of the train line cuts through many councils being counted today. UKIP have been slower to jump on this issue, but we can look at whether it's helped their vote. The potentially affected postcodes are listed by safe-move.co.uk and were coded up using mapit.

Unlike their wind farm success, the regression suggests that there is little difference in UKIP performance in wards affected by HS2.


UKIP 2013 share
Population density
-0.051

(1.94)
HS2
-2.919

(0.81)
_cons
11.580

(18.25)**
R2
0.02
N
291
* p<0.05; ** p<0.01

So far then, UKIP's share does not appear to have been driven primarily by NIMBY issues. Their possible success in mobilizing support around wind farms has not been replicated for HS2, which is potentially much more widely relevant. 

The lack of an effect of HS2 might be seen as a missed opportunity for UKIP. However, it also underscores a positive result for them: their strong showing is not merely the result of canny use of local issues but a genuine national shift in their favour. 


Caveats:
  • These are obviously preliminary results and there may be other factors to control for. I hope to analyse some of these in future posts.
  • The worst affected HS2 postcodes are in Buckinghamshire which the BBC is not covering due to large boundary changes. 
  • It is questionable whether these effects should be seen at ward level or perhaps at district level. I'll look at this question in more detail later.
  • Obviously correlation =/= causation.
  • Ideally, I would show the regression for the changes in the shares since 2009 and 2005 but UKIP has fielded candidates in so many new locations, that there simply aren't enough results for comparison.
  • This blogpost does not reflect the opinion of the BBC or my department.